When Head & Shoulders Works (and When It Doesn't)
The head & shoulders pattern is one of the most reliable reversal setups in technical analysis. But success depends on reading the market context correctly. Learn when this pattern delivers profits and when it fails—plus the exact entry, stop loss, and take profit levels that work.
Shaun Enslin
Trading Analyst at SPYALERTS

Photo by Austin Hervias on Unsplash
Understanding the Head & Shoulders Pattern
The head & shoulders pattern forms after a strong uptrend and signals a reversal to the downside. It consists of three peaks: a left shoulder, a higher head in the middle, and a right shoulder roughly equal in height to the left. The neckline—drawn across the lows between these peaks—acts as the critical support level that, when broken, confirms the reversal.
When Head & Shoulders Works Best
1. Strong Prior Uptrend (3+ months)
The pattern is most reliable after a sustained bull run. If price has been rising steadily for months, the reversal signal carries more weight. Quick rallies create false patterns that collapse just as fast.
2. High Trading Volume at Neckline Break
Volume is the confirmation. When price breaks the neckline with volume **50% above the 20-day average**, sellers are in control. Low-volume breaks often result in quick reversals back above the neckline.
3. Clear Technical Resistance Above the Neckline
If a previous support level, moving average, or gap lies just above the neckline, the pattern has multiple confirmation points. The more confluence, the stronger the setup.
4. Broader Market Weakness
Head & shoulders work best when the overall market (SPY, QQQ) is rolling over. A stock making a perfect head & shoulders while the market rallies often gets pulled higher anyway, invalidating the trade.
When Head & Shoulders Fails
1. During Strong Bull Markets
If SPY and QQQ are in relentless uptrends, individual stocks often shrug off head & shoulders breaks. The momentum upward is too powerful to reverse on a single chart pattern. Wait for the broader market to show weakness first.
2. Immature Pattern (Rising for Less Than 8 Weeks)
A quick run-up that forms a head & shoulders usually means the pattern is just "noise" inside a continuation. Longer trends have stronger reversals.
3. Breakout on Low Volume
If price breaks the neckline but volume stays below average, professional traders aren't selling. Expect a bounce back up and a failed short.
4. Inverse Head & Shoulders (Bullish Reversal) in a Downtrend
If the overall market is in a downtrend, even a textbook inverse head & shoulders can fail because the macro trend is still down. Context always wins.
Entry Strategy & Take Profit Levels
Entry Point:
Enter a short position on the first **close below the neckline** with volume confirmation. Do not wait for a perfect test of the neckline—quick fills are often the best fills in this setup.
Stop Loss:
Place your stop 3–5% above the neckline (or above the right shoulder if it's higher). This gives the trade room to breathe but protects against the pattern invalidating.
Take Profit Level 1 (Conservative):
Target **50% of the distance from the neckline to the bottom of the head**. For example, if the head is 20 points above the neckline, take profit at 10 points below.
Take Profit Level 2 (Moderate):
Target **100% of the head height** below the neckline. This is the "textbook" measurement and the level most traders watch.
Take Profit Level 3 (Aggressive):
Target **150% of the head height** below the neckline. This is for traders who see additional support levels and strong downside momentum. Only hold if price is accelerating downward.
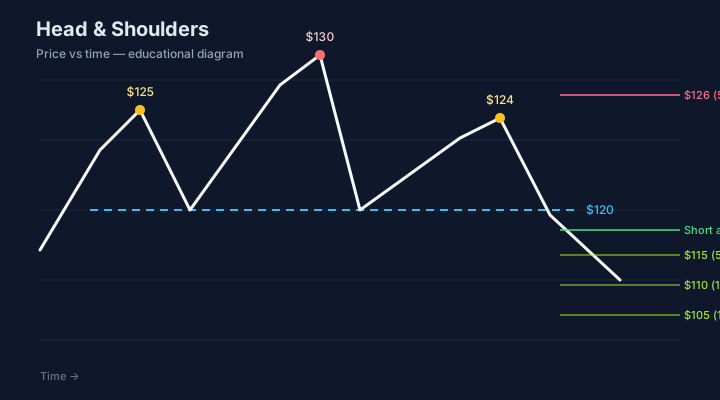
Example Trade Setup
Stock: XYZ rallies from $90 to $130 over 4 months (strong uptrend ✓)
Pattern: Left shoulder $125, head $130, right shoulder $124
Neckline: $120
Head Height: $130 – $120 = $10
Entry: Short at $119.50 (close below neckline with volume 60% above average)
Stop Loss: $126 (5% above neckline)
TP1: $115 (50% of $10 = $5 below neckline)
TP2: $110 (100% of $10 = $10 below neckline)
TP3: $105 (150% of $10 = $15 below neckline)
Key Takeaways
- Head & shoulders is a **strong bearish reversal**, but only after long uptrends and confirmed by volume.
- **Always check the broader market**—a strong SPY/QQQ uptrend can override the signal.
- **Volume is essential**—a neckline break on low volume is a trap; wait for 50%+ above-average volume.
- **Use the head height to calculate targets**—TP1 at 50%, TP2 at 100%, and TP3 at 150% of the pattern height.
- **Risk management first**—place your stop 3–5% above the neckline or above the right shoulder.
- Trade the pattern **in the direction of the macro trend** (short in a market downtrend, long for inverse in uptrend).
The head & shoulders pattern is a tool, not a guarantee. Success comes from combining it with volume analysis, market context, and disciplined position sizing. Use SPYALERTS to scan for these setups and track your entries in our trade journal.
Ready to master trading patterns?
SPYALERTS alerts you to high-probability head & shoulders, triangles, and other reversal patterns in real time. Track your trades in our free trade journal and improve your win rate.
Get Started Free